Columns of Light
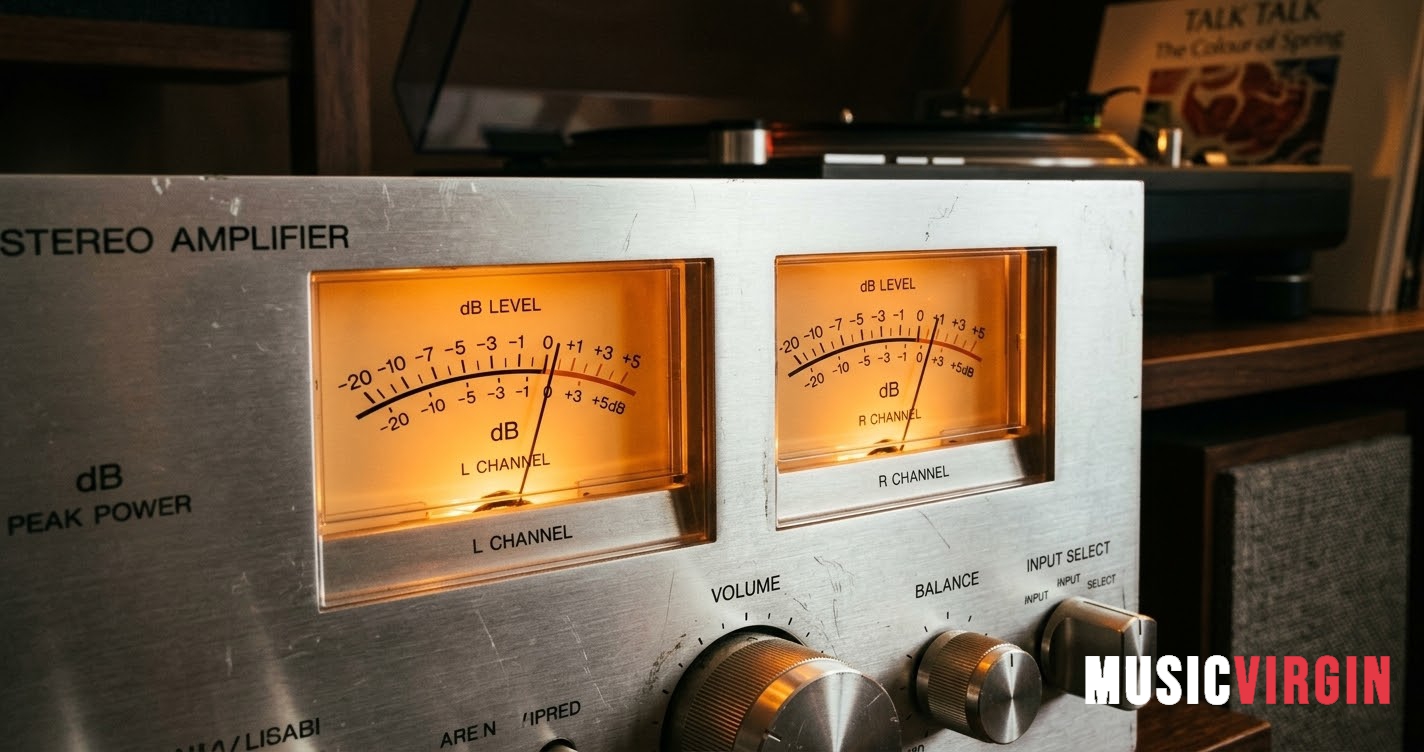
Few pieces of audio equipment have been as immediately, viscerally satisfying to watch as a bank of LED columns responding to music in real time. Each column represents a slice of the frequency spectrum, bass on the left, treble on the right, dancing up and down as the audio moves through them. It is information and spectacle in equal measure, and for roughly two decades from the early 1980s onwards it was the defining visual identity of serious home audio.
The graphic equaliser itself predates the LED display by a considerable margin. Outboard EQ units appeared in recording studios during the 1960s, most famously the Langevin and later the API 560, a ten-band unit in a single rack space that became a standard tool in American studios and has barely changed since. These early units used physical faders and had no display beyond the position of the sliders themselves. The shape of the faders told you the shape of the frequency curve. That is where the word graphic comes from.
What changed in the late 1970s and accelerated through the 1980s was the addition of LED bar graph displays, first to professional equipment, then rapidly to consumer hi-fi separates. The technology was cheap enough to be practical at a consumer price point, bright enough to be readable across a room and dynamic enough to show the movement of music in real time. Once manufacturers realised how much buyers responded to the visual element, the LED equaliser became a product category in its own right.
The Hi-Fi Stack Era
The natural home for the LED graphic equaliser was the hi-fi stack system, the tower of separate components that represented serious audio investment throughout the 1980s and into the 1990s. A typical stack of that era might include a turntable, cassette deck, CD player, tuner, amplifier and sitting somewhere prominent in the middle, a standalone graphic equaliser with its LED display running across the front panel.
Brands like Technics, Sansui, Pioneer and Kenwood built units with ten, fifteen or thirty-one bands, the more bands, the more precise the adjustment and the more impressive the resulting display. A thirty-one band unit covers one-third octave steps across the full audible spectrum, each band with its own fader and its own column of LEDs. Running music through one in a darkened room was an experience in itself.
Gain and sensitivity controls sat alongside the frequency bands. Gain set the overall output level of the equaliser relative to its input, a practical necessity, since boosting multiple frequency bands simultaneously could push the output significantly higher than the source. Sensitivity determined how the LED display mapped to the signal level: calibrate it correctly and the columns used the full height of the display on programme material without constantly hitting the top.
Peak hold added the final layer of practical utility. A single LED at the apex of each column would freeze at the highest point reached and hold for a second or two before dropping. On fast transients, a kick drum, a plucked bass note, a consonant in a vocal line, the signal moves too quickly for the eye to track the column in real time. The peak hold LED gave you a breadcrumb: the highest point the signal reached, visible long enough to act on.
Into the Car
The same display technology found an enthusiastic second home in the car. Through the late 1980s and 1990s, the single-DIN and double-DIN head unit became a canvas for increasingly elaborate LED displays. Brands like Pioneer, Alpine, Clarion and Kenwood competed on specification and visual drama in roughly equal measure. A head unit with a ten-band spectrum analyser across its face, glowing in amber or green or multicolour, was a meaningful selling point in the consumer car audio market.
The in-car environment made the display arguably more useful than in the living room. Road noise, tyre rumble and engine noise create a constantly shifting noise floor that affects how music sounds at different speeds and in different vehicles. Being able to see the frequency distribution of what was playing and adjust the EQ response in real time had genuine practical value beyond aesthetics. Boost the bass band at 80Hz to compensate for road noise masking. Pull back the 4kHz presence range if the door speakers were harsh at higher volumes. The display told you what the signal was doing and the equaliser let you correct it.
Double-DIN units gave manufacturers more vertical space to work with, and some used it ambitiously, display panels that combined a clock, spectrum analyser, signal strength indicator and tape transport status across a single illuminated fascia. By the mid-1990s some higher-end head units were incorporating motorised flip-down screens, but the LED bar graph display remained a staple of mid-range car audio well into the 2000s.
The Professional Studio Context
In the recording studio the graphic equaliser occupied a different role. Outboard rack-mounted units the Klark Teknik DN360, the BSS FCS-966, the dbx 2231 were used primarily for room correction and feedback control in live sound rather than creative tonal shaping, which was generally handled by the more surgical parametric equalisers on the console itself. A graphic EQ inserted across the main outputs of a live PA could be swept to notch out the specific frequencies feeding back in a particular room, with the LED display helping the engineer see which bands were active.
On mixing consoles, the metering philosophy was similar to the hi-fi approach but the demands were higher. Professional console meters on desks like the SSL G Series, Neve VR and Studer Vista — used fast LED bar graph meters with peak hold and clip indicators on every channel, giving the engineer an immediate visual map of where the levels were sitting across the entire mix. The horizontal sweep of a large-format console in full flight, with forty or more columns of LEDs moving independently, remains one of the more compelling sights in professional audio.
What Replaced Them and What Remained
The shift from hardware LED displays to software-based spectrum analysers was gradual through the late 1990s and decisive by the mid-2000s. As Digital Audio Workstations (DAWs) became the primary recording and mixing environment, the hardware EQ display moved into the plugin window. Software analysers could offer higher resolution, logarithmic frequency scaling, adjustable time averaging, true peak detection and real-time frequency overlap, capabilities that a row of physical LEDs could not match.
In hi-fi, the LED graphic equaliser declined alongside the separates stack itself. The shift towards compact systems, sound bars and streaming sources left little space for a standalone unit, and digital signal processing built into amplifiers handled room correction invisibly rather than visually. The ritual of adjusting physical faders and watching the columns respond became a relic of a more hands-on era of audio ownership.
What persisted was the instinct that looking at sound is useful. Every DAW plugin, every hardware processor with a display, every smartphone equaliser app continues the same basic idea the 1980s hi-fi stack made familiar to millions of people: divide the spectrum, show the levels, let the listener respond. The technology changed. The principle did not.
Music Virgin's free online LED graphic equaliser brings that same real-time spectrum display to any browser. It reads from your audio source, responds across the full frequency range and gives you the visual feedback of a classic LED display without the rack space. The columns still dance. The peak hold LEDs still linger. Some things are worth keeping. Enjoy!